
In an era of trading automation, algorithmic trading has become a popular method for gaining profit for a variety of people and companies. The advantage is that you can run an algorithm-based bot to execute trades for you and earn profits across multiple markets. Nevertheless, many algorithms may have low win rates due to the different circumstances that unfold on the market, which makes your algorithm inefficient and useless. That's when machine learning may be useful to solve this problem and maximize potential profit.
How to Enhance Algo Trading Win Rate with ML: Labelling Data
In this series of articles, we will examine if machine learning can improve an algorithmic strategy's win rate on the Binance BTC/USDT market.
This will be accomplished using 1H historical OHLC data.
First, we calculate the win rate of an algorithmic strategy using the Python backtesting library. Next, we use a machine learning model on the same data and timeline to improve our win rate.
In this experiment we will focus on these 3 areas:
Part 1: Labelling Data
Part 2: Feature Selection
Part 3: Comparing backtest results and training
Part 1: Labelling Data
When it comes to the cryptocurrency market, there may be many algorithmic strategies to consider. We will use the simple and popular strategy known as "Moving Average Crossover" to simplify the problem. When the shorter-term SMA crosses above the longer-term SMA, it's a buy signal, since it indicates that the trend is shifting upward. Meanwhile, when the shorter-term SMA crosses below the longer-term SMA, it's a sell signal, as it indicates that the trend is changing downward. The SMA9 and SMA20 of the close price of the Binance BTC/USDT 1-hour timeframe are used in this example.
Our experiment will be implemented in the Jupyterlab environment. Clone the improve_algorithmic_trading_ml repository and run the 1-labeling_data.ipynb for a better understanding.
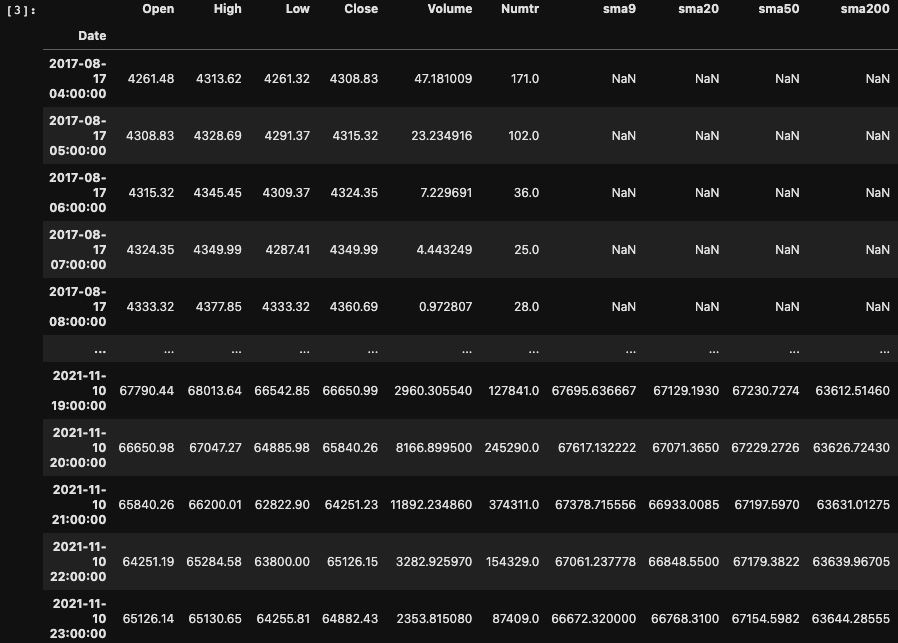
Block [1-3]
First, let's explore the data. In addition to the Binance 1-hour OHLCV data from 2017-08-17 to 2021-11-10, we have added several indicators
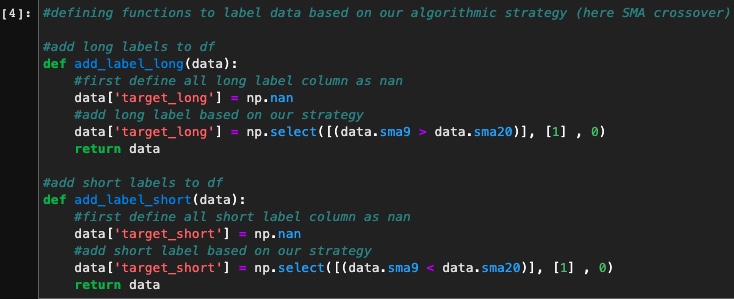
Block [4-8]
Now let’s label our data based on our SMA crossover strategy. To demonstrate that when SMA9 > SMA20 it’s a buy signal so we label our data as "target_long" and on the other hand when SMA9 < SMA20 it’s a sell signal so we label our data as “target_short”.
Then we will visualize the data using the pyplot library. Long labels are on green points and short labels are on red points. And SMA9 and SMA20 are blue and yellow lines, respectively. As a result, we have a good understanding of the distribution of our data. The image below shows a part of the plot.
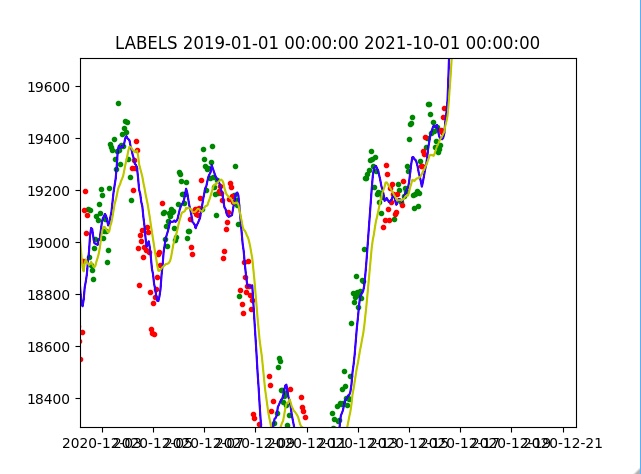
Block [9-13]
The Backtesting library provides a class called Strategy that allows you to create your own strategy for opening and closing long and short positions. Our strategy is to open long positions when we get to a "bull" target and to close long positions when we reach a "bear" point. For short positions, the reverse should be done. Our dataset has two additional columns called "bull" and "bear" that are the same as "target_long" and "target_short" in our crossover strategy, but you can flag your data either as bull or bear if you wish to use a different strategy for labeling. In this way, we don't have to change our backtesting strategy whenever we change our labeling strategy.
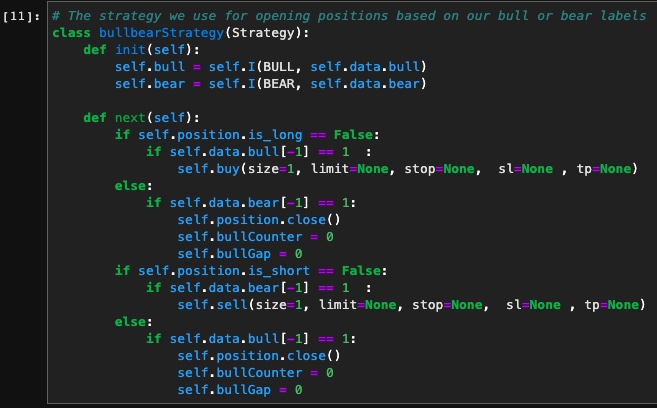
Once we have our backtest function and labeled data ready, let's run a backtest to calculate our crossover strategy win rate:
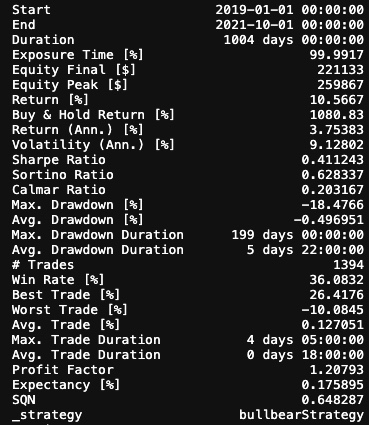
Based on 1394 trades, we had a win rate of 36.08%, which is not as high as you might expect. What we want to discover is how machine learning can improve this win rate for us. One approach is to feed these labels along with some features directly to a machine learning model to see if it can help improve them. But the problem is that when we have so many errors in the labels it means that we are feeding the wrong data to our model and we can't expect better results.
Block [14-19]
In order to fix our labels, we should remove the ones that have given us losses when we have opened buy or sell positions. This is done by iterating through our labels one by one, simulating our backtest strategy, and changing the label when it gives us a loss.
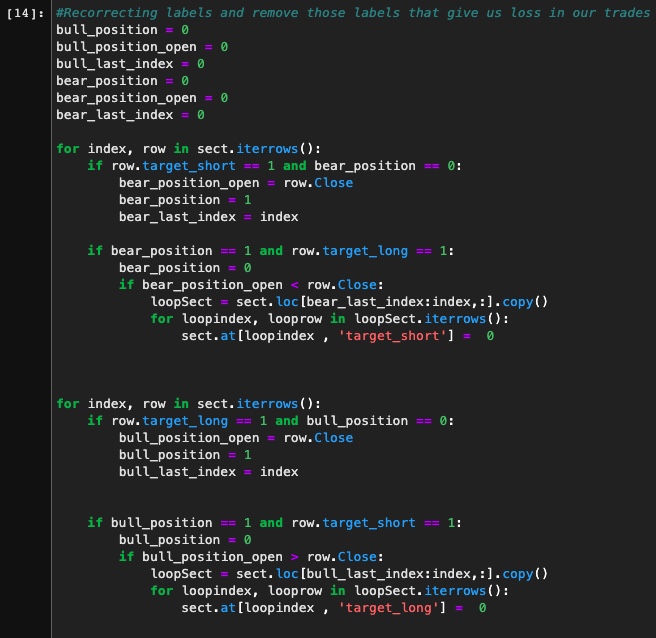
We should be able to run backtests again with a 100% win rate once the wrong labels have been removed. To verify that, we prepare our corrected dataset and repeat the same process as we did for our main strategy.
Our labels have been successfully corrected, as you can see. This gives us a nice clean set of data to feed into our machine learning model.
In the next article, we'll talk about how to find suitable features based on our strategy, then train our model on them and see if we can improve the win rate or not.